The importance of the daily and weekly charts in trading

Still looking at the 1, 5 and 15 minutes charts? I think that you had better quit doing that sort of trading. If you are making money, carry on, but if you still lose money trying day trading, it is best to stop doing day trading and trying other alternatives. Speed is not good.
I spent a lot of time trading with 1, 5, 15 minutes; 1, 4 hours and daily charts.
Every time I tried a scalping strategy and using 1 or 5 minutes charts I was absolutely decimated, even though my previous paper trading said that I was going to win 40% per month. How easy is to do paper trading, you see.
However after those times I would trade using longer time frames, like 4 hours charts and would make 50% a year. But I thought it was not enough. If I had done that from the beginning, I would have saved a lot of money.
Such is life.
I wanted to be the new Jesse Livermore and win 100% monthly.
There are loads of stories around the web and in books where it seems that it can be done easily. And maybe it is possible. But it was not for me. And I think that the majority of people who try day trading will not succeed at it (I would say almost all of them), where brokers’ commissions and psychology play against us.
Besides, there is the fact that you have to spend countless hours in front of the computer, and that is not very healthy.
The problem of trading indicators in charts
The majority of traders use the famous indicators. But, what do they measure? Well, they measure the different combinations of prices for a given moment: moving averages, oscillators, Bollinger, etcetera.
There are also indicators about volume, which could be interesting. However, price indicators I think that may confuse us more than anything else.
The best indicator is the price, and the best “indicator” is a chart with the price shown with points or candlesticks. That and a bit of fundamental and macro analysis is what you need.
The majority of traders use 3, 4, 5 or even more indicators.
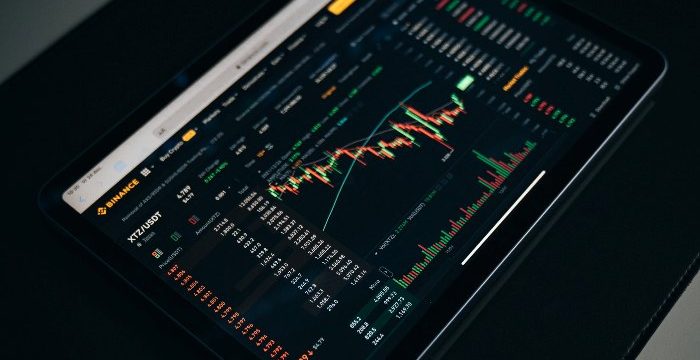
I think that some trading screens look like a mess when they try to use so many indicators. You hardly see the price sometimes.
Forex indicators confusion
Let us say that you specialize in a specific indicator that will supposedly tell you when you have to trade. Then you have another indicator that says: you can “almost” trade. In cases when you have many indicators it can become very confusing for our, already, stressed mind. Sometimes you miss a great opportunity because you saw an “almost” signal, but not traded in the end. You end up angry and frustrated. Next time you see a confusing signal and decide to trade, and you lose. More anger.
When you have 4 or 5 indicators the number of “almost” grows exponentially, and your stress grows too. That is why we had better trade using the price and nothing else.
There is no need for complicated indicators.
The only thing we need is to develop a strategy to trade using the price. And there are many strategies for trading using the price. Less is more. Though, if you are interested in more “complex” methods using the price you can study price action and Japanese candlesticks, and the works of Munehisa Homma, for instance.
Nowadays I only analyze the price, and I do not even try to use Japanese candlesticks strategies. They can be useful but in the end, there is no need to use them.
It is true that, with this sort of trading, I will not double my account every year, but the goal is to make an acceptable profit, and have a lot of patience. As Livermore would say: “it was my sitting, not my thinking”.
When you try to use indicators for day trading, you will have many trades per day or week. Certainly, a lot more than when you use a daily chart. That is the problem of overtrading; a problem associated especially with day trading. And when you trade more than you should it is best for the brokerage. Thanks to that, hundreds of thousands of broker´s employees make a good living all around the world.
Brokers do not make a living through swing or trend traders that trade 30 or 40 times per year. They make a good living through those who make day trading.
Daily chart Forex strategy
The key is to lose quantity and gain quality. 75% of the time, the market hardly moves. If we trade the daily chart with six months timeframe, we will avoid the majority of boring sessions where the market does not move. Swing or trend traders are only interested when the market moves explosively and in a trending way.
Those who make day trading will trade that 75% of the time when the markets are quiet. As a consequence, they will get a lot of bad signals. Those quiet days, they should expect (depending on the strategy) to win more or less the same times than they lose. If we count the commissions, it is hardly a winning strategy for the long run.
Think: if we pay 10$ (round turn) of commissions to a broker every time we buy and sell a stock and I have 2000$ account. If we win as many times as we lose. We will end up losing the entire account after 200 days of trading, supposing I trade once per day. That is quite common in trading. If we do swing or trend trading, we could expect to do 4 or 5 trades per year maybe. And those operations will be of a much better quality. The broker will not be very happy with the latter.
In fact, day trading has more problems. The addictive component is quite important. The day traders become addicted to the screen. Then they end up trading many times per day and when they realize they have lost everything.
Weekly charts trading
When we trade using daily and weekly charts, we are interested in big moves, like 20, 30, 50% moves.
What happens those days when the market ranges one percent up or down does not interest us. It may happen that when there is a breakout and a stock goes up 30% in a few days, many of the day traders will go short every day because their day trading signal gives them a sell order.
When using the daily chart things look clearer. Jesse Livermore took note of the daily moves. He wrote down the maximum and minimum of the day; the opening and the close. He identified the variations of price during months. Well, when he would see a stock trading at a maximum price day after day he would do what he had to do: be long.
You can do whatever you want to do, but years of experience have told me that the business of day trading is not for traders, but for brokers, systems, and course vendors. If someone tries to sell you a course look for that course not to be a day trading one. And the best thing for trend or swing trading is to use the daily or even the weekly charts. A bit of fundamental, macro analysis and good money management and that is all we need to know.


